
BUSINESS
Inflation Fears Sent Silver to $121, Then Cut It in Half
Silver trades 55.7 percent below its January high even with CPI at 3.7 percent, as solar thrifting and a rate shock stripped the inflation bid.

Silver traded at $53.91 an ounce on October 28, 55.7 percent below its 2026 high of $121.67, while gold held at $4,049.05. The gold-silver ratio printed 75.1, up from about 60 in January, on the same afternoon the Federal Reserve left rates unchanged and said inflation remains elevated.
The metal that was sold all year as a CPI hedge had already had its panic bid. That bid took silver above $121 in late January, then broke it. What remains is a factory metal trading $1.25 above its yearly low of $52.66, with consumer prices still running hot on gasoline.
Silver Trades Just Above a 2026 Low
The split on October 28 was the year’s story in one session. Gold was $106.53 above its 2026 low of $3,942.52. Silver had only $1.25 of room above $52.66. Gold is down 6.23 percent, or $269.06, in 2026. Silver is down 24.70 percent, or $17.68, and sits 55.7 percent under $121.67. Gold is 27.7 percent under its $5,598.58 peak. Silver’s year-to-date loss is 3.96 times gold’s.
GOLD AND SILVER ON OCTOBER 28
| Metal | Spot | 2026 high | Off the high | Year to date |
|---|---|---|---|---|
| Gold | $4,049.05 | $5,598.58 | 27.7% | -6.23% |
| Silver | $53.91 | $121.67 | 55.7% | -24.70% |
The ratio’s climb from about 60 to 75.1 means one gold ounce now buys about 15 more ounces of silver than it did in January. Ratio traders still treat a reading in the 70s as a cue to swap gold for silver. The tape this year did the opposite: it stripped silver’s industrial and speculative premium faster than it discounted gold’s monetary role.
A 30-to-1 gold-silver ratio, the 2011 analog still pitched to holders, would require silver to run to $167 if gold were $5,000. That math is being sold into a market that has already chosen gold. Anindya Banerjee, head of FICC research at Kotak Neo, marked silver’s old $55.20 to $55.60 support as resistance and wrote that a break of $53 opens $50 and $48. The October 28 print of $53.91 sits in that zone.
FROM THE SQUEEZE TO THE SLIDE
- October 2025: The Silver Institute later called the month an unprecedented liquidity squeeze, with metal moving into CME vaults, exchange-traded holdings rising, and lease rates exploding.
- January 29, 2026: The Institute recorded an all-time high above $121 on January 29, matching the $121.67 yearly high on the October 28 tape.
- January 30, 2026: Silver fell from that peak to an intraday low just below $75 after President Trump nominated Kevin Warsh as Fed chair, a drop of more than 30 percent in a session.
- April 15, 2026: Metals Focus and the Silver Institute published World Silver Survey 2026, forecasting a 46.3 million ounce deficit even as solar offtake slowed.
- October 28, 2026: The Fed held, silver closed the day at $53.91, and the ratio topped 75.
By early April the Institute already had the metal back in the mid-$70s. The autumn leg then took it from a late-August area near $71 down toward $53 without a bounce that stuck.
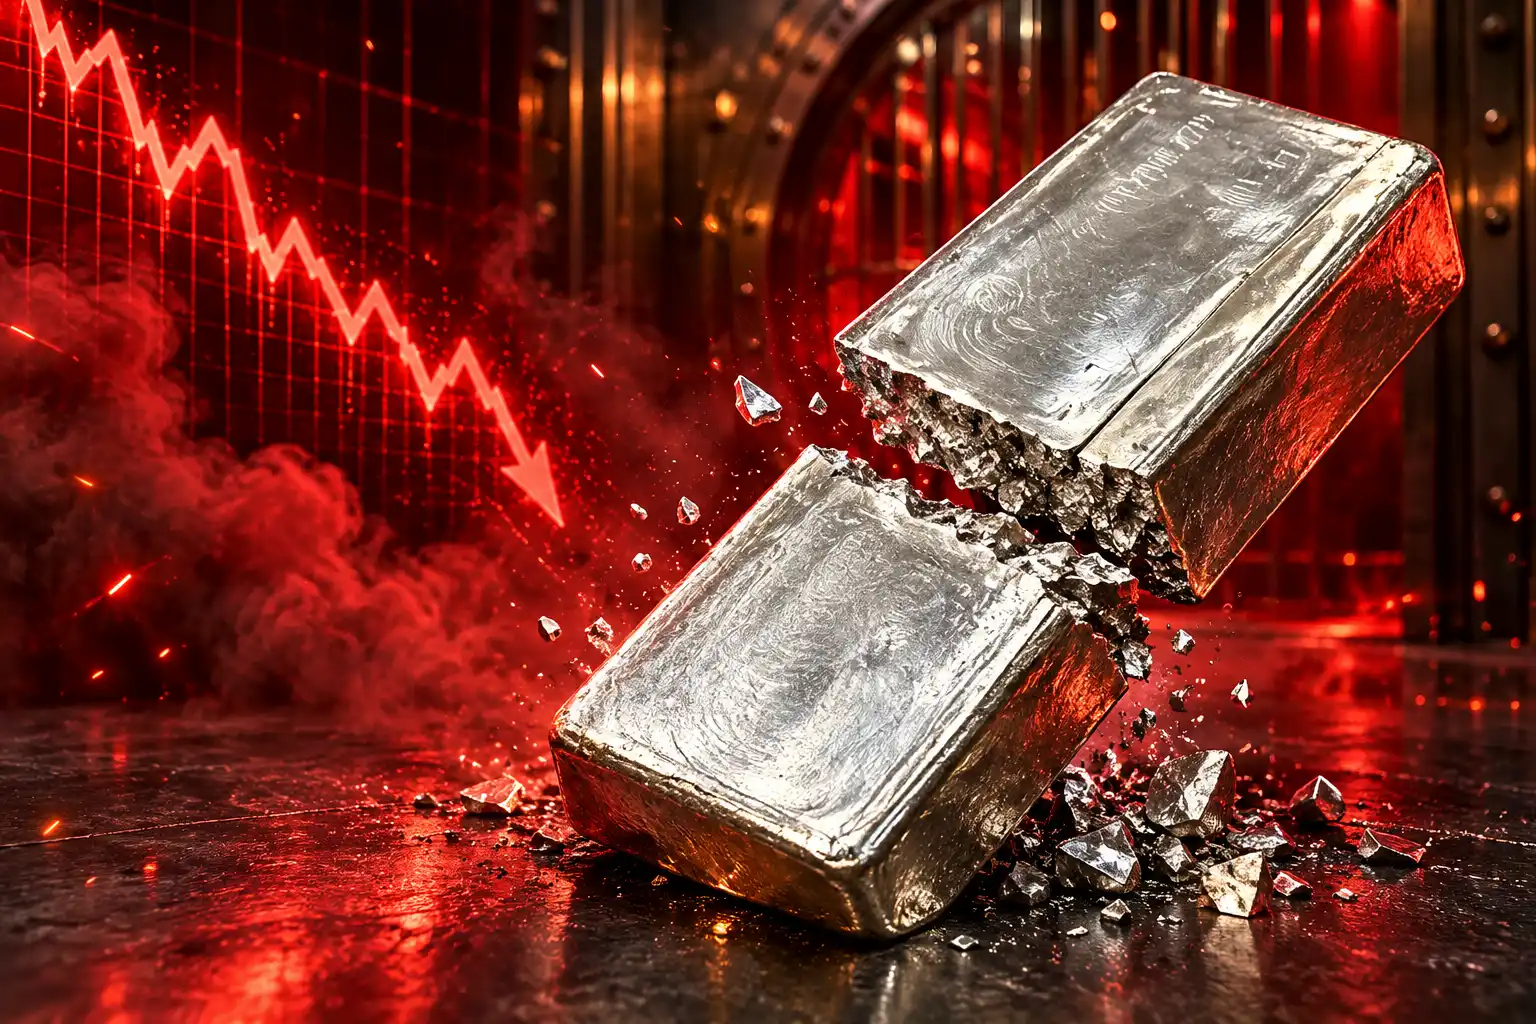
Gasoline Lifted Inflation While Silver Kept Falling
The Bureau of Labor Statistics said consumer prices rose 3.7 percent over the year ending in September, after a 0.6 percent gain that month. Gasoline jumped 9.1 percent in September and 34.2 percent over the year, accounting for more than half of the monthly rise. Energy as a whole was up 20.4 percent over 12 months. Core prices, without food and energy, rose 0.3 percent in September and 2.6 percent over the year. Food was up 2.5 percent. Shelter was up 3.2 percent.
That is the inflation print the hedge pitch points to. It is also a gasoline print. Silver, which pays no yield and is used on factory floors, did not catch the bid that oil put under the CPI. The Fed, voting 10 to 2 on October 28, chose to maintain the federal funds rate at 3.75 to 4 percent and described activity as expanding at a strong pace.
Inflation remains elevated. The accumulation of more information will help the Committee determine the policy stance appropriate to ensure a timely return of inflation to the Committee’s 2 percent goal. The Committee will deliver price stability.
Federal Open Market Committee, October 28, 2026 statement
Lisa D. Cook and Beth M. Hammack voted against the hold and preferred a quarter-point increase. A metals market that had already been punished for pricing easier money did not get a cut. It got a reminder that the 2 percent target is still the job, with Chair Kevin Warsh now running the press conference that follows the vote.
A long study of prices from 1791 to 2010 found gold can hedge US headline, expected, and core CPI over the long run, and that silver does not hedge US consumer prices. The 2026 tape is a live version of that result: gold held above $4,000, silver did not.
Solar Factories Cut Silver Out of New Panels
World Silver Survey 2026, researched by Metals Focus for the Silver Institute, is the ledger the market uses. Total demand fell 2 percent in 2025 to 1.13 billion ounces, the lowest since 2021, and is forecast to fall another 2 percent in 2026 to 1.11 billion ounces. Industrial offtake dropped 3 percent to 657.4 million ounces in 2025 and is forecast to drop another 3 percent this year, chiefly because of solar.
Photovoltaic demand was 197.5 million ounces in 2024, then 186.6 million in 2025, and is forecast at 151 million ounces in 2026, a 19 percent cut. Installations are still rising. The loading in each cell is not. The Institute said intense competition and rising silver raw material costs prompted PV makers to accelerate thrifting and substitution. Silver went from about 8 to 10 percent of a cell’s cost at the start of 2025 to more than 20 percent by year-end, which is the kind of input shock a factory solves by using less metal.
WHERE THE OUNCES ARE GOING
- Solar cells: Forecast demand of 151 million ounces in 2026, down from 186.6 million in 2025, even as global capacity keeps growing.
- Other electronics: Electrical and electronics demand outside solar is cited as rising from 262.9 million ounces to 271.9 million, a gain that does not offset the solar cut.
- Coins and bars: Physical investment jumped 14 percent in 2025 and is forecast to jump 18 percent in 2026, the line the Institute is counting on to plug industrial losses.
- Jewelry and silverware: Double-digit losses are forecast for 2026 as high prices keep choking discretionary buying, especially in India.
The inflation-hedge buyer and the panel maker are now in a contest the panel maker is winning on volume. Every ounce that thrifting removes is an ounce the coin market has to absorb if the deficit is going to stay large. Recycling is not about to close that hole. The Institute put 2025 scrap at a 12-year high of 197.6 million ounces, and IEA PVPS work cited in later analysis still assumes residential panels run about 18 years and utility systems about 26, with only about 10 percent of retired modules recycled worldwide.
Mine Supply Barely Moves When the Price Does
Global mine output rose 3 percent in 2025 to 846.6 million ounces, led by by-product silver from copper mines in Peru and the ramp-up of Polymetal’s Prognoz mine in Russia. North American output fell 3 percent to a 10-year low. The Institute expects mine supply to stay roughly flat in 2026, with grade and operating problems offsetting modest gains at a few assets.
Most silver does not come from mines that are trying to produce silver. Metals Focus and the Institute put about 74 percent of 2025 mine output, 625.5 million ounces, as by-product from other metals, with primary silver mines down to 26.1 percent of the total, versus 32.1 percent in 2016. Copper, lead, and zinc prices set those mines’ budgets. A $121 silver print does not quickly open a new silver pit, and a $54 print does not close a copper pit that happens to throw off silver.
That is why a year that included both a record high and a 55.7 percent drawdown can still be a deficit year. Supply does not flex with the chart. Demand does, and the flex in 2026 is coming from factories cutting loadings, not from a new flood of metal.
What 1980 and 2011 Did After a Record
Silver’s last two completed record runs are the reason the January spike should have scared more people than it thrilled. The metal touched near $50 an ounce in 1980, then spent years going the other way. On monthly averages, the fall from that run reached 91 percent and the next record took more than 31 years. In April 2011 the monthly average peaked near $49, then fell 67 percent, and the wait for the next record was more than 14 years.
THREE RECORD RUNS
| Run | Peak used here | After the last record |
|---|---|---|
| January 1980 | near $50 | 91% fall on monthly averages |
| April 2011 | near $49 | 67% fall on monthly averages |
| January 2026 | $121.67 | 55.7% drawdown by October 28 |
January 2026’s monthly average of $92.10 is the record on that series. Adjusted for US consumer prices, January 1980’s monthly average of $38.90 is about $168 in September 2026 dollars. The 2026 record average is about 43 percent below that real high. Nominal records are not purchasing-power records, and silver has not beaten 1980 in real terms.
The 1970s run is the slide still used to sell silver as an inflation weapon. It is also the run that ended in a crash once Paul Volcker raised rates and the Hunt brothers’ squeeze broke. Gold fell hard from its January 1980 peak. Silver fell harder. The 2026 rhyme is already on the page: a squeeze in late 2025, a $121 print in January, a more than 30 percent session lower on January 30, then a grind toward $53 while the Fed holds at 3.75 to 4 percent and calls inflation elevated.
The Survey Still Calls for a 46 Million Ounce Gap
None of the crash erases the flow math the Institute published in April. It expects the structural deficit to widen to 46.3 million ounces in 2026, a sixth straight shortfall, after a 40.3 million ounce gap in 2025. Cumulative deficits from 2021 through 2026 are put at 762.1 million ounces, about a year of mine supply. Total supply is forecast at 1,066.4 million ounces against demand of 1,112.6 million, so the gap widens because supply shrinks faster than use.
A deficit that large can coexist with a 55.7 percent drawdown because above-ground stocks, exchange inventories, and a stronger dollar can feed the market while the annual flow stays short. COMEX registered inventories have been cited as down about 49 percent from a September 2025 peak even as the price fell. Scarcity of bars in a vault and scarcity of bids in a futures pit are different problems, and this year the pit won.
WHERE FORECASTS DISAGREE
- Silver Institute: World Silver Survey 2026, published April 15, forecasts a 46.3 million ounce deficit for 2026, the sixth in a row.
- HSBC: A late-October assessment puts the 2026 gap at 5 million ounces, still a shortfall, but a much looser one.
Those two numbers are not averaged here. They describe different views of the same year. A 5 million ounce hole is easier for scrap, inventories, and thrifting to cover. A 46.3 million ounce hole is the figure the Institute is still standing on, six months after publication, and it is the figure CME Group has also cited while flagging weaker solar offtake as a near-term offset.
Coin and bar demand is the swing the bulls need. The Institute says that line should jump 18 percent in 2026 after a 14 percent rise in 2025, with India leading and the United States a laggard after three down years. If those buyers do not show up at $54 the way they showed up on the way to $121, the industrial cuts do more of the work, and the deficit shrinks from the demand side.
One Gold Ounce Now Buys 75 Ounces of Silver
The gold-silver ratio at 75.1 is the scoreboard for who kept the monetary bid. Gold’s 2026 high of $5,598.58 and silver’s $121.67 were printed in the same winter panic. Gold gave back 27.7 percent from that peak and still sits above $4,000. Silver gave back 55.7 percent and is testing $52.66. When that pattern holds, the market is treating gold as the hedge and silver as the high-beta tag-along that industrial demand can drop.
Lower rates would help both metals. The October 28 statement did not deliver them. Fiscal deficits and a long oil spike can still stoke inflation expectations, which is the argument for keeping a small metals sleeve. The product choice is the part the January tape made expensive to ignore. Liquid funds swing with the same 2 to 3 percent daily moves the critics have always warned about. Physical coins and bars skip fund fees and add storage and premiums. Mining shares add equity risk on top of the metal.
Silver can still be a slice of a portfolio. It is a poor substitute for the inflation trade people thought they were making at $121. The CPI is at 3.7 percent, the Fed is on hold at 3.75 to 4 percent, solar makers are using fewer ounces per panel, and the metal that held is gold. Silver’s $53.91 print on October 28 left it $1.25 above the year’s low, with a 46.3 million ounce deficit on the books and no floor under the price.
Disclaimer: This article is news reporting and analysis of silver prices, inflation data, and metals-market research. It is informational only and is not investment advice, a recommendation to buy or sell silver, gold, mining shares, or related funds, or a forecast of future prices. Anyone considering a metals position should consult a licensed financial adviser or other qualified professional who can weigh storage costs, premiums, tax treatment, and risk tolerance against a full household balance sheet. Spot prices, CPI readings, Fed policy, and survey forecasts reflect the sources cited as of the dates in this piece and can change with the next session, the next print, and the next revision of the World Silver Survey.

One UI 9.5 Beta Puts the Galaxy S26 on Last Year’s Clock

DBS Puts a 24/7 USDC Window Inside the Bank

European Startups Head for $81 Billion as First Checks Shrink

US Stocks Lost $1.3 Trillion Before Nvidia’s Beat

Home Depot Bets on Finance Chief Richard McPhail as CEO

Aramco Crash Kills 14 Two Days After Oil Restart

Salah Captained Egypt to Their First World Cup Win

Zelda’s 40th Switch 2 Ships Without a Zelda Game

Apple Labor Day Deals Hide June’s Memory Price Hike

El Niño Puts Israel’s Needed Winter Rain on a Flood Clock
-
 BUSINESS5 months ago
Aramco Crash Kills 14 Two Days After Oil Restart
-
 NEWS6 months ago
Salah Captained Egypt to Their First World Cup Win
-
 GAMING2 months ago
Zelda’s 40th Switch 2 Ships Without a Zelda Game
-
 NEWS3 months ago
Apple Labor Day Deals Hide June’s Memory Price Hike
-
 NEWS4 months ago
El Niño Puts Israel’s Needed Winter Rain on a Flood Clock
-

 GAMING2 months ago
Palworld 1.0.4 Adds Palpedia Search After the 1.0 Launch
-

 NEWS4 months ago
Saudi Visa Routes Split Nigerian Travelers Into Two Speeds
-

 BUSINESS9 months ago
BAE’s 60-Year Saudi Franchise Now Runs Through Taif