The USD/CAD pair remains under pressure as traders await the release of the Canadian consumer price index (CPI) for August, which could provide some clues on the Bank of Canada’s (BoC) monetary policy outlook. The pair is trading near a one-month low of 1.3470, as the US dollar struggles to find demand ahead of the Federal Reserve’s (Fed) policy decision on Wednesday.
Loonie Gains on Higher Oil Prices and BoC Optimism
The Canadian dollar, or the Loonie, has been supported by the rally in crude oil prices, which have reached their highest level since November 2022. Canada is one of the world’s largest oil exporters, and higher oil prices tend to boost its terms of trade and economic prospects.

The Loonie has also benefited from the BoC’s relatively hawkish stance, as the central bank has tapered its bond purchases twice this year and signaled that it could start raising interest rates in the second half of 2022. The BoC has maintained that inflation is transitory and will ease as supply chain disruptions and base effects fade, but some analysts expect that the central bank will have to revise its inflation outlook higher in light of the recent data.
Canadian CPI Expected to Remain Elevated in August
The Canadian CPI report for August is due later today at 12:30 GMT and is expected to show that inflation remained elevated at 3.7% year-on-year, unchanged from July and well above the BoC’s target range of 1-3%. On a monthly basis, CPI is forecast to rise by 0.1%, slowing down from 0.6% in July.
The core CPI measures, which exclude volatile items such as food and energy, are also expected to remain high, indicating that inflationary pressures are broad-based and not just driven by temporary factors. The BoC’s preferred core CPI measure, which is the average of three gauges (CPI-trim, CPI-median and CPI-common), stood at 2.5% year-on-year in July, the highest level since 2009.
A stronger-than-expected CPI report could boost the Loonie further and increase the odds of an earlier rate hike by the BoC, while a weaker-than-expected report could ease some of the pressure on the currency and allow for a corrective bounce in the USD/CAD pair.
Fed Decision Looms Large for USD/CAD Direction
The USD/CAD pair is also influenced by the Fed’s policy decision, which will be announced on Wednesday at 18:00 GMT, followed by a press conference by Fed Chair Jerome Powell at 18:30 GMT. The Fed is widely expected to keep its policy settings unchanged, but traders will be looking for any hints on when and how the Fed will start tapering its $120 billion per month asset purchase program.
The Fed has signaled that it could announce tapering later this year, depending on the progress of the economic recovery and inflation. However, the recent slowdown in job growth and the surge in COVID-19 cases due to the Delta variant have raised some doubts about the timing and pace of tapering.
The Fed’s updated economic projections, especially the dot plot that shows the individual rate expectations of Fed officials, will also be closely watched for any changes in the Fed’s rate hike outlook. The previous dot plot in June showed that 13 out of 18 Fed officials expected at least one rate hike by the end of 2023, while seven expected at least one rate hike by the end of 2022.
A hawkish Fed could lift the US dollar and weigh on the USD/CAD pair, while a dovish Fed could dent the US dollar and support the USD/CAD pair.
Technical Levels to Watch for USD/CAD
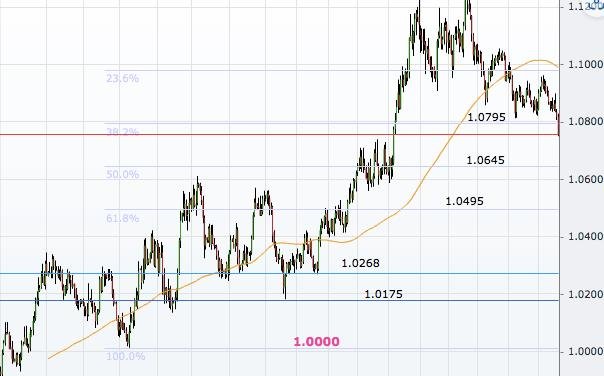
The USD/CAD pair is trading below its 20-day, 50-day and 100-day simple moving averages (SMAs), indicating a bearish trend. The pair is also facing a strong resistance near the 1.3500 psychological level, which coincides with the 50% Fibonacci retracement level of the decline from 1.3640 to 1.3360.
A break above 1.3500 could open the door for a move towards 1.3540 (61.8% Fibonacci retracement level) and 1.3600 (horizontal resistance and round number). On the flip side, a break below 1.3460 (200-day SMA) could trigger a slide towards 1.3400 (horizontal support and round number) and 1.3360 (recent low).
